Last Frost Date vs Hardiness Zone: Which One Sets Planting?
Last frost date vs hardiness zone: the zone is a winter-low number, the frost date is a planting number. Here is what each measures, with NOAA data.
Last frost date vs hardiness zone is the question I wish every planting guide answered before it told me what to do. Most of them hand you a zone and stop, and the zone is the wrong number for timing. This guide explains what each one measures, why they get mixed up, and which to use for which job.
Last frost date vs hardiness zone: the short answer
The hardiness zone tells you how cold winter gets. The last frost date tells you when spring stops freezing. The first job is about which perennials survive. The second job is about when to put out tomatoes. They come from different datasets and they answer different questions.
| USDA hardiness zone | Last frost date | |
|---|---|---|
| What it measures | Average annual extreme minimum winter temperature | Date of the last spring 32°F (or 28°F) reading |
| Period | 1991–2020 | 1991–2020 |
| Unit | 10°F zone bands, split into 5°F half zones (a and b) | A calendar date with a probability, such as 50% |
| Published by | USDA Agricultural Research Service | NOAA National Centers for Environmental Information |
| Best for | Choosing perennials, shrubs and trees that will survive winter | Timing annual vegetables, transplants and seed starting |
| Weak at | Saying anything about spring timing | Saying anything about winter survival |
If you only remember one line from this guide, it is this: a zone is a temperature, and a frost date is a date.
What the USDA hardiness zone actually measures
The USDA Plant Hardiness Zone Map is built from one statistic: the average annual extreme minimum winter temperature, using weather data from 1991 to 2020. The map is divided into 10°F zones numbered from zone 1, the coldest, to zone 13, the warmest. Each zone is split into two half zones, labelled a and b, and each half zone covers 5°F.
The USDA's own "How to use the maps" page is clear about what the map leaves out. It does not show the coldest temperature that has ever occurred at a place or that might occur in the future. It cannot capture microclimates that are smaller than its scale, such as heat near pavement or frost pockets in low spots. It does not account for wind, soil, humidity, snow cover, winter sun, or unusual weather timing like an early autumn cold snap. The USDA calls it a general guide, not a substitute for local experience or the advice of nurseries, Master Gardeners and extension services.
Notice what is missing from that list of purposes. Nothing in the zone definition says anything about April or May. A place lands in a zone because of where its average coldest winter night falls in a 5°F band, and that fact does not tell you whether the last frost comes in mid April or mid May.
What the last frost date actually measures
NOAA's National Centers for Environmental Information publishes U.S. Climate Normals, which are 30-year averages of climate variables. The current set covers 1991 to 2020. Inside the agricultural part of those normals are freeze probabilities for individual weather stations.
The field most gardening sources quote is the 50% probability date of the last spring minimum temperature at or below 32°F. NOAA's data type code for it is ANN-TMIN-PRBLST-T32FP50. There is a matching first fall date, ANN-TMIN-PRBFST-T32FP50, and both exist for a 28°F threshold too.
The 50% part matters. In half of the 30 years in the record, the last 32°F reading at that station came later than the date shown. If you transplant on that date, you are taking about an even chance of one more frost. That is why extension guides tell you to put very tender crops out two or more weeks after it.
NOAA's own page on the last spring freeze adds two caveats worth keeping. The dates are long-term averages, and actual conditions in any given year can vary widely. Some places cannot be computed at all: Puerto Rico is too warm to see a freeze often enough, and many Alaska stations are too cold in summer for the statistic to work.
Why the two get confused
Both are 30-year normals for 1991 to 2020. Both are published by federal agencies. Both appear on the same seed packets and the same garden-centre signs. And in the broad sweep of the country they do move together: places with colder winters tend to have later frost dates.
The trouble is the word "tend". Winter lows are shaped by continental cold outbreaks; spring frost timing is shaped by elevation, latitude, nearby water and how fast a region warms. The relationship is loose enough that using one to estimate the other produces errors of weeks. The next section shows that with real station data.
The numbers: same zone, different frost dates
Here are six NOAA stations pulled from the 1991–2020 annual normals on October 16, 2026. The dates are the 50% probability last spring and first fall 32°F readings. I have not added anything to them.
| Station | Last spring 32°F (50%) | First fall 32°F (50%) | Frost-free days |
|---|---|---|---|
| Boston, MA (USW00014739) | April 6 | November 8 | 216 |
| Denver International Airport, CO (USW00003017) | May 6 | October 6 | 153 |
| Seattle-Tacoma, WA (USW00024233) | March 8 | November 21 | 258 |
| Concord, NH (USW00014745) | May 13 | September 30 | 140 |
| Salt Lake City, UT (USW00024127) | April 21 | October 24 | 186 |
| Philadelphia, PA (USW00013739) | April 2 | November 10 | 222 |
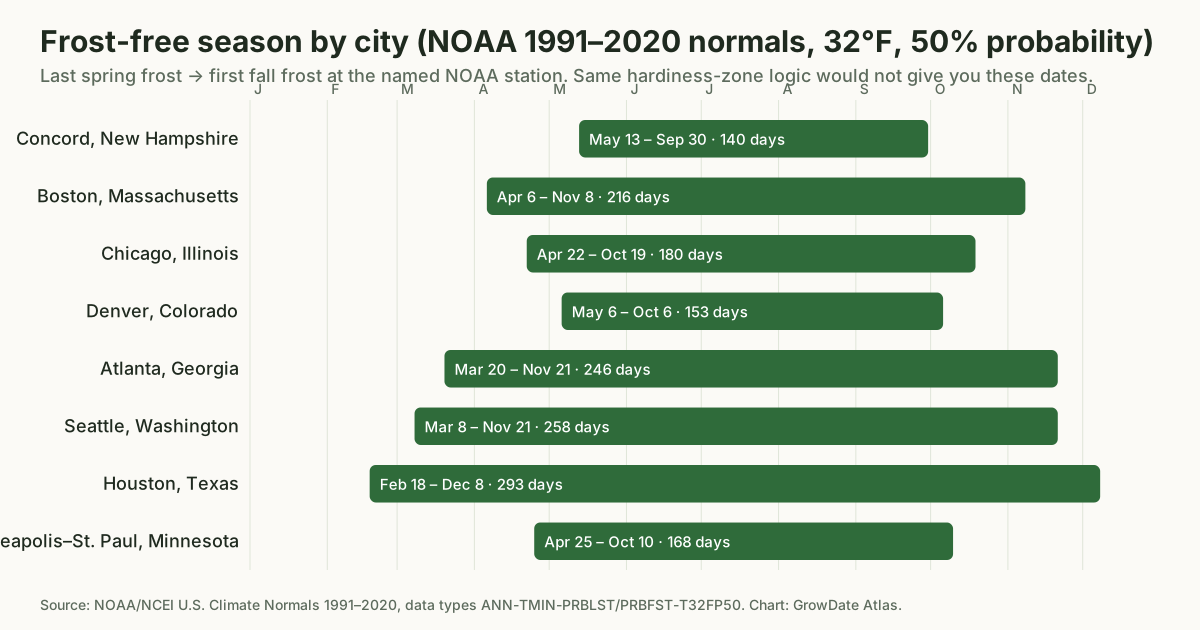
Boston and Denver have 50% last frost dates a month apart, and Denver's frost-free season is 63 days shorter, even though both are large cities that gardeners file under "cold winters". Seattle shows its mild maritime spring with a March 8 last frost, while Concord, about 55 miles from Boston by the station coordinates, does not clear 32°F until May 13, five weeks later. Latitude, elevation and distance from the coast are doing that work, and none of them appear in a zone number.
The bars in the chart at the top of this guide show the same thing for eight cities. The length of the bar, not the zone number, is what decides whether a 100-day winter squash is a sensible bet.
If you want the full table for your own city, every city planting calendar on this site shows the station, its coordinates, its elevation, and all four freeze dates.
Which number to use for which job
The split is simple once you see what each statistic measures.
| Garden decision | Use the hardiness zone | Use the frost date |
|---|---|---|
| Will this apple tree, rose or perennial survive winter here? | Yes | No |
| When do I start tomato seeds indoors? | No | Yes |
| When can peas and spinach go in the ground? | No | Yes |
| When do I transplant peppers? | No | Yes |
| Is there time for a 100-day winter squash? | No | Yes, with the first fall date too |
| When is the last date to sow fall carrots? | No | Yes, counting back from the first fall date |
| Should I buy a fig for the ground or a pot? | Yes | No |
For annual vegetables, which is what most of us are timing each spring, the hardiness zone has almost no role. Every rule in a good planting guide is written relative to the last frost date.
How extension guides turn a frost date into a planting date
The Colorado State University Extension vegetable planting guide, CMG GardenNotes #720, groups vegetables into four classes and gives each class a window relative to the average last spring frost. In the guide's own words:
- Hardy: "As early as 2-4 weeks before the date of the average last spring frost."
- Semi-hardy: "As early as 0-2 weeks before the date of the average last spring frost."
- Tender: "From seed: around the date of the average last spring frost."
- Very tender: "Typically 2+ weeks after the average last spring frost date."
Peas, spinach, radishes, broccoli and cabbage are hardy. Beets, carrots, cauliflower and potatoes are semi-hardy. Snap beans, sweet corn and cucumbers are tender. Tomatoes, peppers, eggplant, melons and winter squash are very tender.
Apply those rules to Concord's May 13 date and you get broccoli transplants from April 15 to April 29, beets sown April 29 to May 13, and tomatoes out from May 27 to June 10. Apply them to Boston's April 6 date and every window shifts five weeks earlier. Same rules, different frost date, different calendar. That is exactly what the planting calendar tool does when you type in two dates.
The same guide also says that soil temperature is one of the best ways to decide spring planting time, and I agree with it. The frost date gets you to the right fortnight. A soil thermometer tells you whether the ground is ready this week.
Fall planting needs the other frost date
The first fall frost date is the one most zone-based guides ignore completely. Purdue Extension's fall vegetable garden bulletin, HO-66-W, sets fall planting dates by counting a crop's days to maturity backwards from the first fall frost. It also defines the classes the other way round: hardy vegetables tolerate several hard frosts, semi-hardy ones tolerate a light frost, and tender ones are damaged by even a light frost.
So a 60-day crop in Concord, where the first fall 32°F date is September 30, needs to be in the ground by around August 1. In Atlanta, where the first fall 32°F date is November 21, the same crop can wait until late September. No zone number gets you there.
32°F or 28°F: which threshold to plan around
NOAA publishes both. The 32°F date is the one for tender crops, because light frost damage starts there. The 28°F date marks a hard freeze that kills most tender plants outright. Hardy greens like spinach and kale shrug off 32°F and keep going, which is why the 28°F fall date is a better guide to how late they can stand.
At Concord the two spring dates are May 1 for 28°F and May 13 for 32°F, twelve days apart. At Seattle they are February 12 and March 8, nearly a month apart. The gap between the two is a rough measure of how long a cool, marginal spring lasts at that station, and it is one more thing a zone cannot tell you.
The limits of a station frost date
A frost date is a much better planting number than a zone, but it has its own limits, and it is better to know them.
- It describes one station, usually an airport. Your yard may be a few miles away, lower, higher, or shaded.
- It is a probability from a 30-year record. It is not a forecast for this spring.
- The 50% date is a coin flip. Shift later for tender crops, as the extension rules already do.
- Frost pockets and cold-air drainage can make a low garden run a week or two behind the station.
- Elevation changes the date. Every city page on this site shows the station elevation so you can compare it to yours.
None of these are reasons to go back to the zone. They are reasons to treat the frost date as a starting point, watch the ten-day forecast around it, and keep some row cover handy.
What to do with this
Find the 50% last spring 32°F date and the first fall 32°F date for the NOAA station nearest you. Write both at the top of your garden notebook. Apply the four class rules to the spring date, count days to maturity back from the fall date, and you have a calendar that reflects your climate instead of a national colour band.
The methodology page lists every source used on this site, and the Concord, New Hampshire calendar is a worked example built from the exact dates quoted above.
When someone next tells you to plant by your zone, ask them for the frost date instead. In the debate of last frost date vs hardiness zone, the frost date is the one that decides when your seeds go in.
Sources
- USDA Agricultural Research Service, How to Use the Maps, USDA Plant Hardiness Zone Map
- NOAA NCEI, When to Expect Your Last Spring Freeze
- NOAA NCEI, U.S. Climate Normals, annual/seasonal 1991–2020 product, retrieved October 16, 2026
- Colorado State University Extension, Vegetable Planting Guide, CMG GardenNotes #720
- Purdue Extension, The Fall Vegetable Garden, HO-66-W
Frequently asked questions
Is the last frost date the same as the hardiness zone?
No. The USDA hardiness zone is the average annual extreme minimum winter temperature for 1991–2020, in 10°F bands. The last frost date is the date in spring after which a 32°F reading is no more likely than not, taken from the NOAA 1991–2020 normals for one station. One is a winter-low number and the other is a spring-timing number.
Can I find my last frost date from my hardiness zone?
Not reliably. The zone is built from the coldest winter night and the frost date from spring temperatures, and the two move only loosely together. Boston and Denver differ by a full month in their 50% last spring 32°F dates, April 6 and May 6. Use the station frost date from NOAA, or your county extension office, instead of converting a zone.
What does a 50% probability frost date mean?
It is the date on which, in half of the years from 1991 to 2020, the last 32°F reading had already happened, and in the other half it had not. Planting on that date means a roughly even chance of one more frost. Waiting one to two weeks lowers the risk for tender crops.
Should I use the 32°F or the 28°F date?
Use the 32°F date for planning tender vegetables, because that is where light frost damage starts. The 28°F date marks a hard freeze that kills most tender plants outright and is useful for judging how long row cover might be needed in spring or how late hardy greens can stand in fall.
Where do I find the official last frost date for my town?
NOAA's U.S. Climate Normals 1991–2020 publish the last spring and first fall freeze probability dates for thousands of stations. County extension offices usually quote the same figures. GrowDate Atlas lists the station, the exact field names and the retrieval date on every city page.