Growing Season Length by City: Frost-Free Days
Growing season length runs from 140 frost-free days in Concord, NH to 297 in Sacramento. Full table for 39 NOAA stations, and what the number decides.
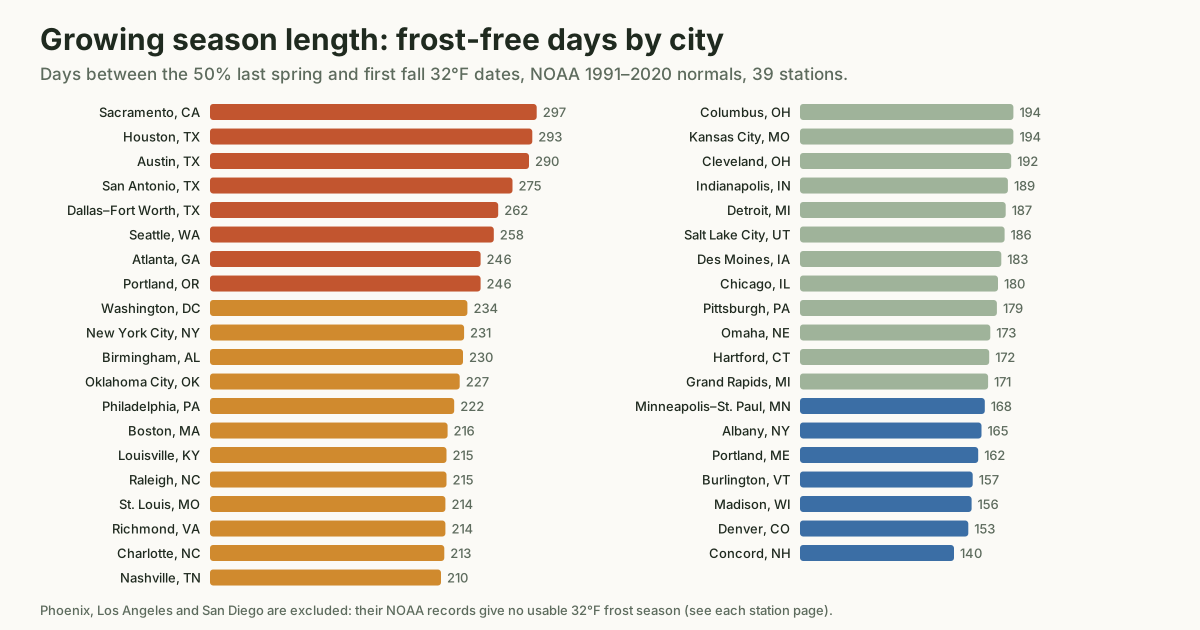
Growing season length is the number of days between your last spring frost and your first fall frost, and across the cities on this site it more than doubles from one end of the table to the other: 140 frost-free days in Concord, New Hampshire, against 297 in Sacramento, California. That single number decides which crops fit, whether a second fall sowing is possible, and how much slack a late spring leaves you.
This guide gives the full table for all 39 stations that have a computable frost season, explains exactly how the number is calculated, and shows what it does and does not tell you. Every figure comes from the NOAA 1991–2020 U.S. Climate Normals for the station named on each city planting calendar, or from subtraction between those dates.
How growing season length is measured
The growing season, in the sense gardeners use it, is the frost-free period: the run of days with no freeze. This site measures it as the number of days between two NOAA dates for the same station:
- the 50% probability date of the last spring minimum at or below 32°F, and
- the 50% probability date of the first fall minimum at or below 32°F.
So Concord's season runs from May 13 to September 30, which is 140 days. Sacramento's runs from February 9 to December 3, which is 297.
Two details are worth knowing before you compare numbers from different sites.
The probability level changes the answer. A 50% date is the median of 30 years. A site that uses a more cautious probability, such as 30%, moves the spring date later and the fall date earlier, which shortens the season. For Oklahoma City, the Old Farmer's Almanac quotes a 201-day season at 30% probability; the same station gives 227 days at 50% on this site. The frost date probability guide works through that example in full.
There are two ways to get a "50% season". NOAA also publishes a freeze-free period statistic for each station. NC State Extension's guide to interpreting NOAA freeze probabilities describes it as the number of consecutive days without a freeze at each probability level. That figure is worked out from the season length in each individual year. This site's figure is the gap between two medians. The two usually land within a few days of each other, but they are different calculations, so a small mismatch between this site and a NOAA freeze-free table is expected, not an error.
Frost-free days by city: the full table
Ordered from the longest season to the shortest. The 28°F column is the same calculation using the hard-freeze dates, which matters for hardy crops; more on that below.
| Station | Last spring 32°F | First fall 32°F | Frost-free days (32°F) | Days between 28°F dates |
|---|---|---|---|---|
| Sacramento, CA | Feb 9 | Dec 3 | 297 | 340 |
| Houston, TX | Feb 18 | Dec 8 | 293 | 331 |
| Austin, TX | Feb 19 | Dec 6 | 290 | 322 |
| San Antonio, TX | Mar 1 | Dec 1 | 275 | 304 |
| Dallas–Fort Worth, TX | Mar 8 | Nov 25 | 262 | 286 |
| Seattle, WA | Mar 8 | Nov 21 | 258 | 300 |
| Atlanta, GA | Mar 20 | Nov 21 | 246 | 277 |
| Portland, OR | Mar 16 | Nov 17 | 246 | 293 |
| Washington, DC | Mar 28 | Nov 17 | 234 | 260 |
| New York City, NY | Apr 1 | Nov 18 | 231 | 253 |
| Birmingham, AL | Mar 27 | Nov 12 | 230 | 262 |
| Oklahoma City, OK | Mar 27 | Nov 9 | 227 | 251 |
| Philadelphia, PA | Apr 2 | Nov 10 | 222 | 244 |
| Boston, MA | Apr 6 | Nov 8 | 216 | 237 |
| Louisville, KY | Apr 3 | Nov 4 | 215 | 238 |
| Raleigh, NC | Apr 3 | Nov 4 | 215 | 243 |
| St. Louis, MO | Apr 3 | Nov 3 | 214 | 234 |
| Richmond, VA | Apr 4 | Nov 4 | 214 | 240 |
| Charlotte, NC | Apr 4 | Nov 3 | 213 | 238 |
| Nashville, TN | Apr 6 | Nov 2 | 210 | 234 |
| Columbus, OH | Apr 16 | Oct 27 | 194 | 215 |
| Kansas City, MO | Apr 12 | Oct 23 | 194 | 212 |
| Cleveland, OH | Apr 22 | Oct 31 | 192 | 216 |
| Indianapolis, IN | Apr 16 | Oct 22 | 189 | 211 |
| Detroit, MI | Apr 20 | Oct 24 | 187 | 211 |
| Salt Lake City, UT | Apr 21 | Oct 24 | 186 | 218 |
| Des Moines, IA | Apr 17 | Oct 17 | 183 | 203 |
| Chicago, IL | Apr 22 | Oct 19 | 180 | 202 |
| Pittsburgh, PA | Apr 24 | Oct 20 | 179 | 204 |
| Omaha, NE | Apr 21 | Oct 11 | 173 | 195 |
| Hartford, CT | Apr 24 | Oct 13 | 172 | 200 |
| Grand Rapids, MI | Apr 28 | Oct 16 | 171 | 198 |
| Minneapolis–St. Paul, MN | Apr 25 | Oct 10 | 168 | 190 |
| Albany, NY | Apr 28 | Oct 10 | 165 | 189 |
| Portland, ME | May 1 | Oct 10 | 162 | 186 |
| Burlington, VT | May 4 | Oct 8 | 157 | 179 |
| Madison, WI | May 2 | Oct 5 | 156 | 178 |
| Denver, CO | May 6 | Oct 6 | 153 | 171 |
| Concord, NH | May 13 | Sep 30 | 140 | 160 |
Three stations in the pilot are missing. Phoenix's NOAA dates put the last spring 32°F date after the first fall one, so there is no frost season to measure. Los Angeles and San Diego have no computable 32°F dates at all, because a freeze is too rare there for NOAA to calculate the normal. Their station pages explain this rather than inventing a number.
The 39 stations in four bands
The chart at the top of this page colors the stations into four bands. Grouped that way, the table reads like this:
| Frost-free days | Stations | Which ones |
|---|---|---|
| Under 170 | 7 | Concord, Denver, Madison, Burlington, Portland (ME), Albany, Minneapolis–St. Paul |
| 170 to 199 | 12 | Grand Rapids, Hartford, Omaha, Pittsburgh, Chicago, Des Moines, Salt Lake City, Detroit, Indianapolis, Cleveland, Columbus, Kansas City |
| 200 to 239 | 12 | Nashville, Charlotte, St. Louis, Richmond, Louisville, Raleigh, Boston, Philadelphia, Oklahoma City, Birmingham, New York City, Washington |
| 240 or more | 8 | Portland (OR), Atlanta, Seattle, Dallas–Fort Worth, San Antonio, Austin, Houston, Sacramento |
The bands are a reading aid, not a classification any source publishes. They do line up with one practical boundary, though: every station that loses a fall sowing for any crop sits in the shortest band, as the section on second sowings below explains.
Season length tells you how long, not when
Two cities can have almost the same season length and very different calendars, and two cities can share a frost date and still differ in length.
Same length, different months. Atlanta and Portland, Oregon both have 246 frost-free days. Atlanta's runs March 20 to November 21; Portland's runs March 16 to November 17. Those happen to line up closely. But Boston at 216 days and St. Louis at 214 are nearly equal in length while Boston's season starts three days later and ends five days later, so a planting date in one is not quite a planting date in the other.
Same fall frost, different length. Seattle and Atlanta share a first fall 32°F date, November 21. Seattle's last spring frost is March 8 and Atlanta's is March 20, so Seattle's season is 12 days longer. Every fall planting date is the same in both cities, because those are counted back from the shared frost date, but spring planting starts nearly two weeks earlier in Seattle.
That is why every city page on this site shows the two dates, not just the length. The length tells you what fits. The dates tell you when to do it.
What the season length decides
Whether the long crops fit
The days to maturity in Colorado State University Extension's Vegetable Planting Guide, GardenNotes #720 run from 30 days for radishes to 125 for potatoes. In a 297-day season, every one of the 27 crops on this site fits with months to spare. In a 140-day season, the long crops start to press against the edges.
Very tender crops do not get the whole season
The frost-free period overstates the time available to the most tender crops. GardenNotes #720 puts very tender crops, such as tomatoes, peppers, melons and winter squash, outdoors typically two or more weeks after the last spring frost. This site uses a window of 2 to 4 weeks after it.
In Concord that means the earliest transplant date for a tomato is May 27, not May 13. From May 27 to the first fall frost on September 30 is 126 days, not 140. The season length is the ceiling; the very tender crops live under it.
Whether a second fall sowing is possible
A longer season leaves room to plant the same crop twice: once in spring, and again late enough to finish before the first fall frost. The fall planting calendar guide explains the count-back rule behind those fall dates.
On this site, a crop gets a separate fall sowing only when its last fall planting date falls more than four weeks after its spring window closes. Under that test, 36 of the 39 stations get a separate fall window for all 27 crops. The exceptions are all at the short end of the table:
- Concord, NH (140 days): no separate fall sowing for potatoes, cantaloupe, winter squash or watermelon. The latest date winter squash can go in and still mature before September 30 is June 22, less than two weeks after its spring window closes.
- Denver, CO (153 days) and Madison, WI (156 days): no separate fall sowing for winter squash.
Burlington, Vermont, at 157 days, keeps all 27, which puts the practical threshold for this crop list somewhere between 156 and 157 frost-free days. That is a property of these 27 crops and their listed days to maturity, not a general law; a short-season variety changes it.
The hard-freeze season for hardy crops
Hardy crops such as cabbage, broccoli, peas and radishes tolerate a light freeze, so a 32°F night does not end their season. For them, the more useful measure is the time between the last spring and first fall 28°F dates, the hard-freeze threshold NC State Extension uses.
That season is 18 to 47 days longer than the 32°F season at the stations here. The difference is smallest in the interior (18 days in Denver and Kansas City, 20 in Concord) and largest on the Pacific coast (42 in Seattle, 43 in Sacramento, 47 in Portland, Oregon). The frost date probability guide shows the spring side of that gap city by city.
In practice this is why cool-season crops are the backbone of a short-season garden. A Concord gardener has 140 days for tomatoes and 160 for cabbage.
What growing season length does not tell you
It is one number about one kind of weather. It leaves out a lot.
- Heat. A 290-day season in Austin and a 258-day season in Seattle are not the same growing conditions, and frost-free days say nothing about summer temperatures. This site does not publish heat measures, because they are not in the dataset it uses.
- This year. A 50% date is the middle of 30 years. In about half of springs the last freeze comes later, and in about half of falls the first freeze comes earlier, so an individual year's season can be noticeably shorter than the table.
- Your garden. Each figure belongs to a weather station, mostly at airports. A garden in a low spot or well above the station's elevation can run a shorter season. The planting calendar tool has a control to shorten the season at both ends for that reason; the methodology page explains what a station record does and does not describe.
Used for what it is, though, the number is a good first filter. Find your station, read the two dates and the length between them, check the longest crops you want to grow against it, and you know before buying seed what your growing season length will and will not allow.
Sources
- NOAA National Centers for Environmental Information, U.S. Climate Normals 1991–2020, 50% probability last spring and first fall dates at 32°F and 28°F. Retrieved October 16, 2026. Season lengths on this page are the count of days between those dates.
- Colorado State University Extension, Vegetable Planting Guide, CMG GardenNotes #720, reviewed September 2024. Crop classes, transplant windows and typical days to harvest.
- Nelson, El-Khoury and Boyette, Interpreting Freeze / Frost Probabilities from the National Centers for Environmental Information, NC State Extension AG-873, revised December 11, 2024. Freeze-free period and hard-freeze definitions.
- The Old Farmer's Almanac, Frost Dates for Oklahoma City, OK, read October 17, 2026.
Frequently asked questions
How is growing season length measured?
The usual measure is the number of frost-free days: the days between the average last spring frost and the average first fall frost. On this site it is the count of days between a station's NOAA 1991–2020 50% probability last spring 32°F date and its 50% probability first fall 32°F date.
Which city has the longest growing season on this site?
Sacramento, California, at 297 frost-free days, followed by Houston at 293 and Austin at 290. The shortest is Concord, New Hampshire, at 140 days. Phoenix, Los Angeles and San Diego are not ranked because their NOAA records give no usable 32°F frost season.
Is the growing season the same as the frost-free period NOAA publishes?
Close, but not identical. NOAA also publishes a freeze-free period statistic for each station, computed from the season length in each individual year. This site's figure is the gap between the two 50% dates. The middle of 30 season lengths and the gap between two middle dates usually land within days of each other, but they are different calculations.
Does a longer growing season mean I can grow anything?
No. Frost-free days measure only the stretch without a 32°F night. They say nothing about summer heat, rainfall or day length, and the very tender crops cannot use the whole stretch, because Colorado State Extension puts them outdoors two or more weeks after the last frost date.
How long is the growing season for hardy crops?
Longer, because hardy crops shrug off a light freeze. Measured between the 50% last spring and first fall 28°F dates instead, the season grows by 18 to 47 days across the stations here: from 160 days in Concord to 340 in Sacramento.