Last Frost Date Probability: What the 50% Date Means
A 50% last frost date is a coin flip: half of years freeze later. Why sites disagree on your date, and which probability and temperature to plant by.
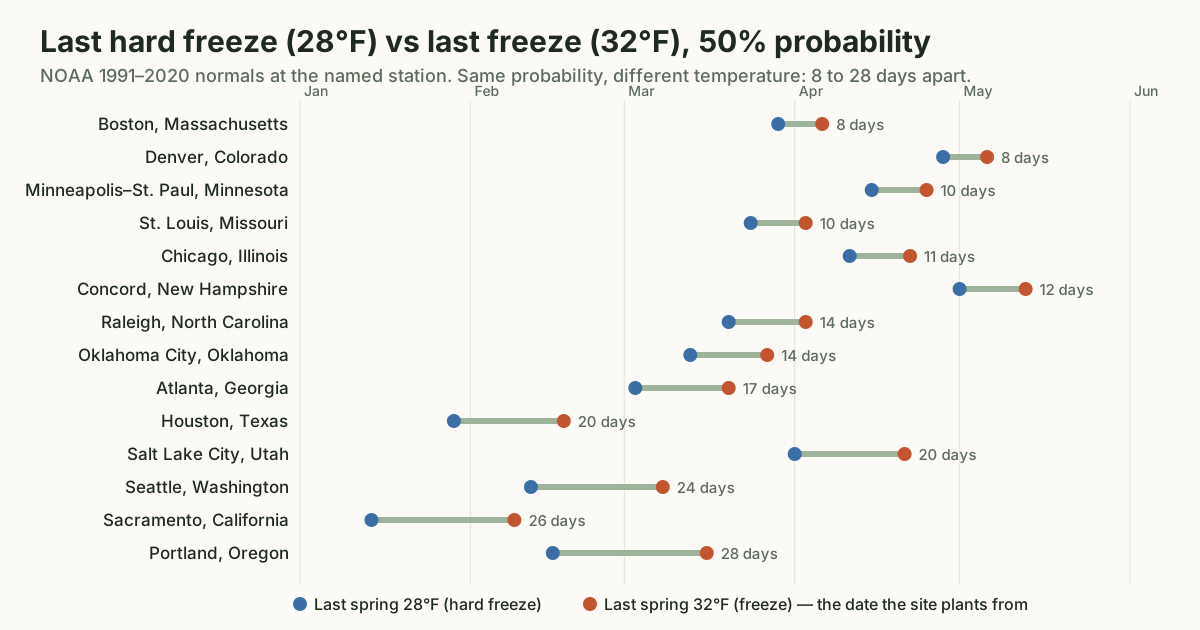
Last frost date probability is the number most planting charts leave out, and it is the reason two websites can give you two different "last frost dates" for the same town. The usual last frost date is a 50% date: in half of past springs, the last freeze came later than that. It is a coin flip, not a deadline.
This guide explains what the probability on a frost date means, why it moves your date by weeks, how the 32°F and 28°F thresholds differ, and which combination to plant by. The dates come from the NOAA 1991–2020 U.S. Climate Normals for the stations named on each city planting calendar, and the explanation of probability levels follows NC State Extension's guide to interpreting NOAA freeze and frost probabilities.
What the probability on a last frost date means
A frost date is not measured. It is calculated from 30 years of daily low temperatures at one weather station. For each year, NOAA finds the last day in spring when the low reached the threshold temperature. That gives 30 dates, one per year, and they are spread across several weeks. The published frost date is a point on that spread.
The probability says which point. NOAA publishes the spring dates at levels from 10% to 90%, and each one answers the same question: what is the chance that the last freeze of spring comes after this date?
- The 50% date is the median. In half the years, the last freeze came later. This is what most sites, including this one, mean by "the last frost date".
- The 10% date is later in spring. Only about 1 year in 10 had a freeze after it.
- The 90% date is earlier in spring. About 9 years in 10 still had a freeze after it.
Fall dates run the same scale in the other direction. The probability is the chance that the first freeze of fall comes on or before the date, so a 10% fall date is early in the autumn and a 90% date is late.
NC State Extension turns this into a risk choice. For spring and fall dates, it describes the 10% date as the conservative, low-risk option, the 50% date as the moderate option, and the 90% date as the aggressive, high-risk one. That ordering is the whole practical meaning of last frost date probability: the further toward 10% you move a spring planting date, the less likely a freeze is to arrive after it.
One more detail matters here. NOAA's published value is a probability date at a stated temperature, so every frost date really has two settings, a probability and a threshold. Change either one and the date changes.
How accurate are last frost dates?
They are accurate about the past and loose about any single spring. That is the honest answer, and it comes from what the number is.
A 50% last frost date describes 30 springs, 1991 to 2020. It says where the middle of those springs fell. It says nothing about whether this April will be early, late or ordinary, because it is a climate summary, not a forecast. NC State Extension says the same in plainer terms: the tables are best guesses from past trends, not guarantees for a given year.
So a 50% date is right in exactly the way it claims to be. Plant a frost-tender crop on it every year and, over a long run of springs, roughly half of those plantings would see one more freeze. That is a perfectly accurate statement, and it is a bad plan for tomatoes.
There are two further limits that have nothing to do with probability:
- It is one spot. Each date belongs to a named weather station. On this site those are mostly airports. A garden in a valley bottom, on a north-facing slope or well above the airport's elevation can frost later in spring than the station does. The methodology page explains what a station record does and does not describe.
- It is a temperature, not a frost. A 32°F reading is a freeze in the air at the sensor. Frost on leaves also depends on humidity and on calm, clear nights, which is why NC State Extension uses 36°F as its frost threshold. A plant can be frosted on a night the station never reaches 32°F.
None of that makes frost dates useless. It makes them a planning number. You use the date to decide when to start seeds and when to expect to plant. Then you check the forecast for the actual week.
Why two sites give different last frost dates for the same town
Oklahoma City shows the problem cleanly, because two sites use the same station and the same dataset and still disagree.
The Old Farmer's Almanac frost dates page for Oklahoma City names its nearest climate station as Oklahoma City Will Rogers airport, at 1,286 feet, and cites NOAA's 1991–2020 Climate Normals. This site's Oklahoma City planting calendar uses the same station, Oklahoma City Will Rogers World Airport, at 391.7 meters (about 1,285 feet), from the same normals.
| Old Farmer's Almanac | GrowDate Atlas, 32°F | GrowDate Atlas, 28°F | |
|---|---|---|---|
| Station | Will Rogers airport | Will Rogers World Airport | Will Rogers World Airport |
| Dataset | NOAA 1991–2020 normals | NOAA 1991–2020 normals | NOAA 1991–2020 normals |
| Probability stated | 30% | 50% | 50% |
| Temperature stated | Not stated | 32°F | 28°F |
| Last spring frost | April 10 | March 27 | March 13 |
| First fall frost | October 29 | November 9 | November 19 |
| Season length | 201 days | 227 days | 251 days |
Almanac figures were read from its page on October 17, 2026. GrowDate Atlas figures are NOAA values retrieved October 16, 2026; the season lengths in those columns are the count of days between the two dates.
The Almanac's spring date is two weeks later than this site's 32°F date, and its fall date is 11 days earlier. Its season is 26 days shorter. Nobody has made an error. The Almanac picked a more cautious probability, 30%, which means only about 3 springs in 10 had a freeze after April 10. This site picked the median.
There is one thing the table cannot tell you, and it is worth saying plainly: how much of that two-week gap comes from the probability, and how much from the temperature. The Almanac page does not state which temperature its date refers to. If it used 32°F, the whole gap is probability. If it used a warmer frost threshold, some of it is temperature. A reader cannot separate the two, which is the strongest argument for using a source that states both.
The practical lesson is short. Before you compare two frost dates, check that both state a probability and a temperature. If one does not, the comparison is not like for like.
32°F vs 28°F: freeze and hard freeze
The threshold is the second setting, and it moves the date about as much as the probability does.
NC State Extension defines a freeze as air below 32°F and a hard freeze as air below 28°F. NOAA publishes probability dates at both, and every city page on this site shows the two. They do different jobs:
- 32°F is the freeze that damages the crops Colorado State Extension classes as tender or very tender: snap beans, sweet corn, cucumbers, squash, tomatoes, peppers, eggplant and melons. It is the date this site counts every crop window from.
- 28°F is the hard freeze. It matters most for the crops Purdue Extension classes as hardy, such as cabbage, broccoli, kohlrabi and peas, which Purdue says can withstand several hard frosts in fall.
Because 28°F is colder, it happens less often, so the last 28°F night of spring comes earlier than the last 32°F night. How much earlier depends heavily on the place. The gap at the 50% level, spring and fall, from the planting calendars on this site:
| Station | Last 28°F | Last 32°F | Spring gap | First 32°F | First 28°F | Fall gap |
|---|---|---|---|---|---|---|
| Boston, MA | Mar 29 | Apr 6 | 8 days | Nov 8 | Nov 21 | 13 days |
| Denver, CO | Apr 28 | May 6 | 8 days | Oct 6 | Oct 16 | 10 days |
| Minneapolis, MN | Apr 15 | Apr 25 | 10 days | Oct 10 | Oct 22 | 12 days |
| Chicago, IL | Apr 11 | Apr 22 | 11 days | Oct 19 | Oct 30 | 11 days |
| Concord, NH | May 1 | May 13 | 12 days | Sep 30 | Oct 8 | 8 days |
| Oklahoma City, OK | Mar 13 | Mar 27 | 14 days | Nov 9 | Nov 19 | 10 days |
| Atlanta, GA | Mar 3 | Mar 20 | 17 days | Nov 21 | Dec 5 | 14 days |
| Houston, TX | Jan 29 | Feb 18 | 20 days | Dec 8 | Dec 26 | 18 days |
| Seattle, WA | Feb 12 | Mar 8 | 24 days | Nov 21 | Dec 9 | 18 days |
| Portland, OR | Feb 16 | Mar 16 | 28 days | Nov 17 | Dec 6 | 19 days |
The pattern is visible in the chart at the top of this page. In the cold-winter interior, the 28°F and 32°F dates sit close together: a spring that is still producing 32°F nights is usually only a week or two past its 28°F nights. Along the Pacific coast and in the South, the two dates pull apart. Portland, Oregon's last hard freeze is typically in mid-February, but light freezes keep turning up for another four weeks.
That matters for what you plant. In Portland, a hardy crop that only fears 28°F can go in a month before a tender one is safe. In Boston, the same two crops are only about a week apart.
Which probability and temperature should you plant by?
There is no single right setting. There is a right setting for each crop and for how much a loss would cost you.
| Planting decision | Temperature to watch | Probability to plan by |
|---|---|---|
| Tender transplants (tomatoes, peppers, eggplant) | 32°F | 50%, plus the 2+ week buffer below, or a later date if a loss would hurt |
| Tender direct sowing (beans, squash, cucumbers) | 32°F | 50%, around the date itself |
| Hardy spring crops (peas, spinach, cabbage, broccoli) | 32°F | 2–4 weeks before the 50% date, per Colorado State Extension |
| Hardy crops left in for fall harvest | 28°F | Past the first fall 32°F date; watch the 28°F date as the season closes |
| Expensive or irreplaceable plants | 32°F | The most conservative date you can find, then the forecast |
The buffer in the first row is not this site's invention. Colorado State University Extension's Vegetable Planting Guide, GardenNotes #720, puts very tender crops outdoors typically two or more weeks after the average last spring frost. This site reads "average last spring frost" as the 50% probability 32°F date. That is an editorial mapping, stated on the methodology page, because the guide does not name a probability level itself.
In other words, the timing rules already build in a safety margin for the crops that need it most. A tomato planted 2 to 4 weeks after the 50% date is planted well past the median spring freeze. That is why this site keeps the 50% date as the anchor rather than switching to a more cautious one: shifting the anchor and keeping the buffer would count the caution twice.
Where you might still want more margin:
- Your garden runs colder than the station. The planting calendar tool has a control that shortens the season at both ends by up to three weeks. How many days to shift is your own judgement; no NOAA table or extension guide publishes that number for a particular yard.
- A loss would be expensive. Bought transplants, or plants you cannot easily replace, justify a later date than spare seedlings you grew yourself.
- You are planting on a schedule, not a forecast. If you cannot check the forecast and cover plants on short notice, plan nearer the conservative end.
The seed-starting guide shows how the same 50% date drives indoor sowing, and the last frost date vs hardiness zone guide explains why a zone number cannot stand in for any of these dates.
What this site does and does not show
Every city planting calendar on GrowDate Atlas shows four NOAA values for its station: the last spring and first fall dates at 32°F, and the same two at 28°F, all at the 50% probability level. Each page names the station, prints its coordinates and elevation, and states the retrieval date.
It does not yet show the 10% and 90% dates. NOAA publishes them for the same stations, and they would let you see how wide each city's spread of last-freeze dates actually is. Until they are added, the honest summary is this: the 50% date is the middle, the spread on either side is real, and the forecast for planting week is the final word.
The short version
A frost date has two settings: a probability and a temperature. The common "last frost date" is the 50% date at 32°F, which means half of past springs froze later. A site that quotes 30% will give you a later spring date for the same station, and a site that does not state its temperature cannot be compared with one that does. The 28°F hard-freeze date comes 8 to 28 days earlier in spring across the cities here, so it matters most for hardy crops. Plan tender crops from the 32°F date with the extension buffer already built in, and adjust for a cold garden or an expensive planting. That is everything the last frost date probability is telling you.
Sources
- NOAA National Centers for Environmental Information, U.S. Climate Normals 1991–2020, annual/seasonal product, data types ANN-TMIN-PRBLST/PRBFST at T32FP50 and T28FP50. Retrieved October 16, 2026.
- Nelson, El-Khoury and Boyette, Interpreting Freeze / Frost Probabilities from the National Centers for Environmental Information, NC State Extension AG-873, published February 28, 2020, revised December 11, 2024.
- Colorado State University Extension, Vegetable Planting Guide, CMG GardenNotes #720, reviewed September 2024.
- B. Rosie Lerner, The Fall Vegetable Garden, Purdue Extension HO-66-W, reviewed September 2019.
- The Old Farmer's Almanac, Frost Dates for Oklahoma City, OK, read October 17, 2026.
Frequently asked questions
What does a 50% probability last frost date mean?
It means that in half the years of the 1991–2020 record, the last spring temperature of 32°F or below came after that date, and in the other half it came before. It is the middle of the range, not a promise. Planting a frost-tender crop on the 50% date is a coin flip on whether one more freeze arrives.
How accurate are last frost dates?
They are accurate as descriptions of the past and loose as predictions of any one spring. A NOAA frost date summarises 30 years at a single weather station, usually an airport. It cannot forecast this year's weather, and it describes the station's spot rather than your garden. Use it to plan the season, then watch the forecast for the actual planting week.
Why does the Old Farmer's Almanac give a different last frost date than this site?
Because the two use different conventions on the same NOAA data. For Oklahoma City the Almanac's page names the Will Rogers airport station and NOAA 1991–2020 normals, states 30% probability and does not state a temperature. It gives April 10. This site uses the same station at 50% probability and 32°F and gives March 27.
Should I plant by the 32°F date or the 28°F date?
Plan by the 32°F date. That is the freeze that damages tender crops, and it is the date this site's crop windows are counted from. The 28°F date is the hard freeze, which matters most for hardy crops still in the ground late in fall. It falls 8 to 28 days earlier in spring across the cities on this site.
Is the 10% or the 90% date the safer one to plant by?
For a spring planting date, the 10% date is the safer one. It is the date after which a last freeze arrived in only about 1 year in 10, so it falls later in spring than the 50% date. NC State Extension describes the 10% spring date as the conservative choice and the 90% date as the aggressive one.