How Frost Dates Are Calculated From NOAA Freeze Normals
How frost dates are calculated: 30 years of daily lows at one station, one freeze date per year, then probability dates. NOAA's method, step by step.
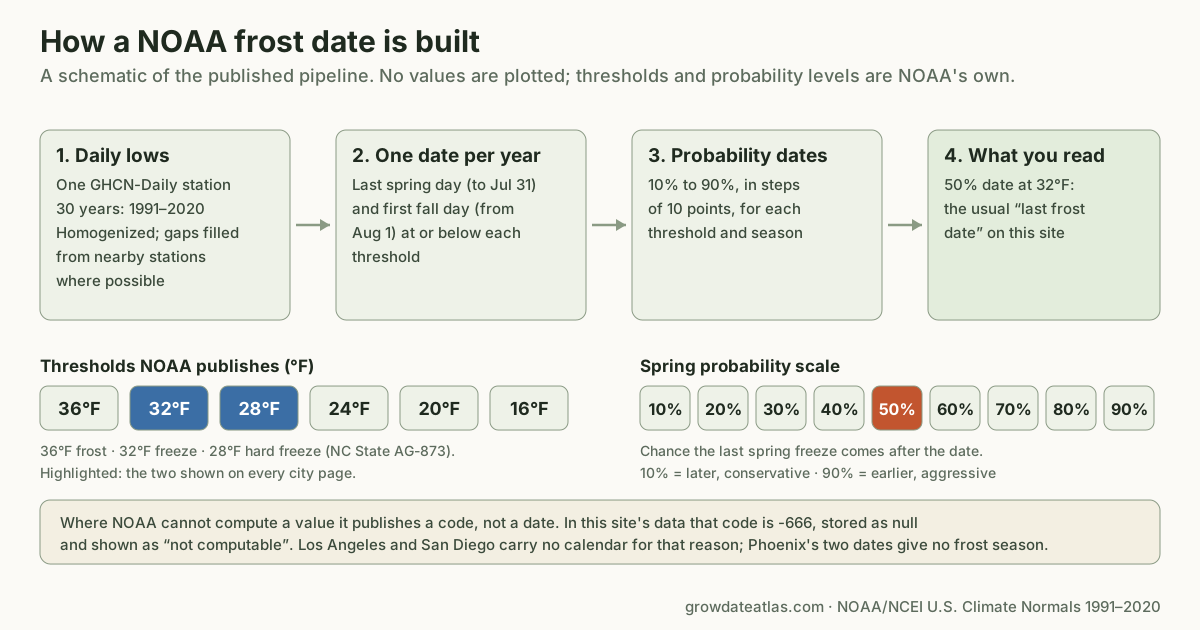
How frost dates are calculated is simpler than the tables make it look. NOAA takes 30 years of daily low temperatures at one weather station, finds the last spring day and the first fall day at or below a threshold in each year, and turns those 30 dates into probability dates. The "last frost date" most gardeners use is the middle one: the 50% date at 32°F.
This guide follows that pipeline step by step, using NOAA's own descriptions of the U.S. Climate Normals and the summary tables NOAA's National Centers for Environmental Information (NCEI) publish, and shows where each figure on a GrowDate Atlas city planting calendar comes from. What the probability level means for planting decisions is covered separately in last frost date probability; this page is about where the numbers are made.
Where official frost dates come from
The source is the U.S. Climate Normals, produced by NCEI. NCEI defines a normal as the 30-year average of a variable's measurements over a uniform period. The current period is 1991 to 2020. NCEI first released it in May 2021 as version 1.0.0, and reissued statistics for 23 stations in 2023 as version 1.0.1.
NCEI produces the official normals every 10 years. The World Meteorological Organization requires 30-year averages to be computed at least every 30 years and recommends a decadal update, and NCEI follows the recommendation. That means a frost date has a vintage. A date from the 1981–2010 normals is one full release out of date, and NCEI warns that comparing a station across the two periods requires its comparison files rather than a straight subtraction.
The normals are not one table. NCEI publishes annual and seasonal, monthly, daily and hourly products, covering more than 7,300 stations with temperature normals. Frost dates live in the annual and seasonal product. Its federal catalogue entry lists, among its agricultural statistics, growing degree days, growing season lengths, and "probabilities of first or last temperature threshold exceedances". Those exceedance probabilities are the frost dates.
Step 1: thirty years of daily lows at one station
Every frost date belongs to one station. The normals are built from the Global Historical Climatology Network's daily and monthly datasets, which hold the daily minimum temperature recorded at each site.
The raw record is not used as-is. The federal data catalogue entry for the 1991–2020 annual and seasonal normals says temperatures were homogenized, adjusted for time of observation, and made serially complete where possible using information from nearby stations. In plain terms: NCEI corrects for things like a thermometer being moved or read at a different hour, and fills gaps in a station's record from its neighbours where it can. That is why a normal can exist for a station whose record has some missing days.
On this site each city uses one such station, named on its page by its GHCN-Daily identifier. Concord, New Hampshire uses USW00014745, Concord Municipal Airport, at 105.5 metres. The station is the measurement; the city name is a label.
Step 2: one freeze date per year
For each of the 30 years, the method needs two dates per temperature threshold: the last day in spring when the low reached the threshold, and the first day in fall when it did.
NCEI's summary tables state the boundary between the two seasons. Spring dates run "through Jul 31". Fall dates begin "Aug 1". So a freeze on July 15 counts as a spring freeze, and one on August 20 counts as a fall freeze. That split is what lets one record produce both a last spring date and a first fall date.
The thresholds are 36°F, 32°F, 28°F, 24°F, 20°F and 16°F, the six rows in every NCEI summary table. NC State Extension's guide to interpreting NOAA freeze and frost probabilities explains the three that matter most for growers:
| Threshold | NC State Extension's term | What it means for a garden |
|---|---|---|
| 36°F | Frost | No single temperature defines frost; 36°F is where frost risk rises, depending on humidity |
| 32°F | Freeze | Air below 32°F; the threshold that damages tender crops |
| 28°F | Hard freeze | Air below 28°F; kills most tender plants outright |
NC State adds a point that is easy to miss: a freeze can happen without frost, and frost without a freeze. Frost forms on surfaces, and on a clear, calm night a leaf can be colder than the air at the sensor. The threshold dates are air temperatures, not frost observations.
Step 3: from thirty dates to probability dates
Thirty years give 30 last-spring dates, spread over several weeks. The published value is a point on that spread, chosen by probability.
NCEI publishes nine probability levels for each threshold and season, from 10% to 90% in steps of 10. Its summary tables define each one precisely. For spring: the "probability of later date in spring (through Jul 31) than indicated". For fall: the "probability of earlier date in fall (beginning Aug 1) than indicated". Both are footnoted as the probability of observing a temperature as cold or colder than the threshold beyond the date.
Read the spring 50% date at 32°F, then, as: in half of the years, a reading of 32°F or colder came after this date. Climate.gov's 2025 article on its interactive map of the last spring freeze says the same in gardener's terms: the map shows the average date on which the chance of freezing temperatures drops below 50 percent.
The full grid for one station is therefore 6 thresholds by 9 probability levels for spring, the same again for fall, plus a freeze-free period table. That is 108 dates per station before the season lengths. A gardener needs two of them.
Which two dates this site uses
Every city page on GrowDate Atlas shows four of the 108: the spring and fall 50% dates at 32°F and at 28°F. They are downloaded from NCEI's access service under these data type names:
| Data type | Meaning | Concord, NH |
|---|---|---|
| ANN-TMIN-PRBLST-T32FP50 | Last spring 32°F, 50% | May 13 |
| ANN-TMIN-PRBFST-T32FP50 | First fall 32°F, 50% | Sep 30 |
| ANN-TMIN-PRBLST-T28FP50 | Last spring 28°F, 50% | May 1 |
| ANN-TMIN-PRBFST-T28FP50 | First fall 28°F, 50% | Oct 8 |
The names are compact once decoded. ANN is the annual product, TMIN the daily minimum, PRBLST the probability of the last spring date and PRBFST the first fall date, T32F the threshold, and P50 the probability level. Every planting window on the site is arithmetic on the two 32°F dates. The methodology page lists the access method and retrieval date.
The freeze-free period is its own table
NCEI also publishes a freeze-free period: the number of days between the last spring freeze and the first fall freeze. It is a separate table with its own probability levels, and its probability runs the other way. NCEI's tables label it the "probability of longer than indicated freeze free period". NC State notes the consequence: for the freeze-free period, 90% is the conservative level and 10% the aggressive one, the reverse of the spring and fall dates.
This site does not download that table. When a city page says "140 frost-free days", that is the count of days between its two 50% dates at 32°F, a simple subtraction. It is a reasonable summary of the typical season, but it is not guaranteed to match NOAA's own 50% freeze-free period, which is computed from the per-year season lengths rather than from two separate medians. The growing season length guide uses the same subtraction across all 39 cities and says so.
When NOAA cannot calculate a frost date
Some stations do not freeze often enough to produce a normal. NCEI's published tables mark gaps two ways: "-9999: Data not available" and a blank for "missing or insufficient data". The API values this site downloaded carry a third code, -666, for a freeze normal that could not be computed.
Three of this site's 42 pilot stations show what that looks like:
- Los Angeles International Airport and San Diego International Airport return -666 for all four freeze dates. Freezes are too rare there. The site stores those values as "not computable" and builds no calendar.
- Phoenix Airport returns a 28°F code of -666, and 32°F dates of January 6 for the last spring freeze and January 2 for the first fall freeze. A first fall freeze four days before the last spring freeze describes a station with essentially no freeze season, so frost-offset planting rules mean nothing there and the site shows no calendar for it either.
The honest response to a missing normal is to say it is missing. Filling it with a guessed date, or borrowing one from a station 50 miles inland, produces a number that looks official and is not.
How far a station's frost date travels
A normal describes its station. How well it describes your garden depends on the distance and on what differs between the two places.
Climate.gov's freeze map states the two big patterns: the farther north or higher in elevation you go, the later the last spring freeze generally arrives. The pilot stations on this site show the elevation effect clearly. Denver's station sits at 1,650.2 metres and has a 153-day season between its 50% 32°F dates; Boston's sits at 3.7 metres and has 216, despite Boston being farther north.
Climate.gov also notes that its map is interpolated between station dots, meaning values in the background are estimated where there are no direct observations. That is worth remembering about any frost date looked up by ZIP code. Unless the source names the station, a ZIP-code date is either the nearest station's figure or an estimate between stations, and you cannot tell which.
Local features the normals cannot see include valley bottoms where cold air pools, slopes, nearby water and pavement. The planner tool lets you shift both frost dates by a number of days you choose for those reasons. The number is your judgement; no NOAA table publishes it.
Reading your own station's frost dates
If your town has its own station in the normals, you can read its full table. Many state climate offices and National Weather Service offices republish NCEI's "Summary of Annual Normals" for 1991–2020 as a PDF per state. Each station block has three tables: spring freeze dates, fall freeze dates and the freeze-free period, with the six thresholds down the side and probability levels .10 to .90 across the top.
To find the equivalent of a GrowDate Atlas date, read the 32°F row at the .50 column of the spring table for the last frost, and the same cell of the fall table for the first frost. To plan more cautiously, move toward the .10 column in both tables. It is the date beyond which only about 1 year in 10 saw the freeze, so spring .10 falls later than spring .50 and fall .10 falls earlier than fall .50. The freeze-free period table is the exception: there the cautious column is .90.
The short version
NOAA does not measure a frost date. It calculates one. Thirty years of homogenized daily lows at one station give one last-spring and one first-fall date per year, split at July 31, at six thresholds from 36°F to 16°F. Those 30 dates become probability dates from 10% to 90%. The usual last frost date is the 50% date at 32°F: half of years froze later. Normals are updated every 10 years, stations that rarely freeze get no value at all, and each date describes its own station rather than your garden. That is how frost dates are calculated, and every one on this site carries the station and data type it came from.
Sources
- NOAA National Centers for Environmental Information, U.S. Climate Normals: definition, update cycle, 1991–2020 release and version 1.0.1, station counts, product types. Retrieved 2026-10-17.
- NOAA/NCEI, U.S. Climate Normals 2020: U.S. Annual/Seasonal Climate Normals (1991–2020), data.gov catalogue entry: source networks, homogenization and serial completeness, agricultural statistics. Retrieved 2026-10-17.
- NOAA/NCEI, Summary of Annual Normals 1991–2020 (state tables as republished by NWS and NDSU): spring and fall season boundaries, thresholds, probability definitions, missing-value codes. Retrieved 2026-10-17.
- Nelson, El-Khoury and Boyette, Interpreting Freeze / Frost Probabilities from the National Centers for Environmental Information, NC State Extension AG-873, revised December 11, 2024. Retrieved 2026-10-17.
- Rebecca Lindsey, Interactive map: Average date of last spring freeze across the United States, Climate.gov, April 17, 2025 (archived). Retrieved 2026-10-17.
- NOAA/NCEI Access Data Service v1, dataset normals-annualseasonal, the four data types listed above for each pilot station. Retrieved 2026-10-16.
Frequently asked questions
Where do official frost dates come from?
In the United States, from the NOAA National Centers for Environmental Information U.S. Climate Normals. The current set covers 1991 to 2020 and was first released in May 2021. Its annual and seasonal product includes the probability of first or last temperature threshold exceedances, which is where the spring and fall freeze dates come from.
How often are frost dates updated?
Every 10 years. NCEI produces the official normals once a decade, and the next set will replace the 1991–2020 figures. Between releases NCEI can reissue individual stations: 23 stations were reissued in 2023 as version 1.0.1. A frost date quoted from 1981–2010 normals is a decade out of date.
Why does my frost date come from an airport?
Because the long, complete temperature records that normals need are mostly kept at airports and other official observing sites. On this site, most of the 42 pilot stations are airports. Each city page prints the station name, coordinates and elevation so you can judge how far it is from your garden.
What does it mean when no frost date is given for a station?
NOAA could not compute one. In the summary tables a blank means missing or insufficient data, and -9999 means data not available. In the API values this site downloaded, -666 marks a freeze normal that could not be computed. Los Angeles and San Diego return that code for all four freeze dates, so neither has a calendar.
Can I look up the frost dates for my own weather station?
Yes. NCEI publishes the annual and seasonal normals for each station through its data download and access services. Many state climate offices and National Weather Service offices also republish the NCEI summary tables as PDFs, listing spring and fall freeze dates at six thresholds and nine probability levels for every station in the state.